

So you finally launched an experiment and are eagerly checking Superwall's dashboard for results ... we've all been there :)
Two questions will inevitabley come to mind:
When can I consider an experiment finished?
How much did our conversion rate increase?
These seemingly innocent questions actually require a ton of complicated math to answer. Until now, most customers resorted to using external AB testing calculators but we knew we could do better. Starting today, you'll see 2 new columns in an experiment's readout table:
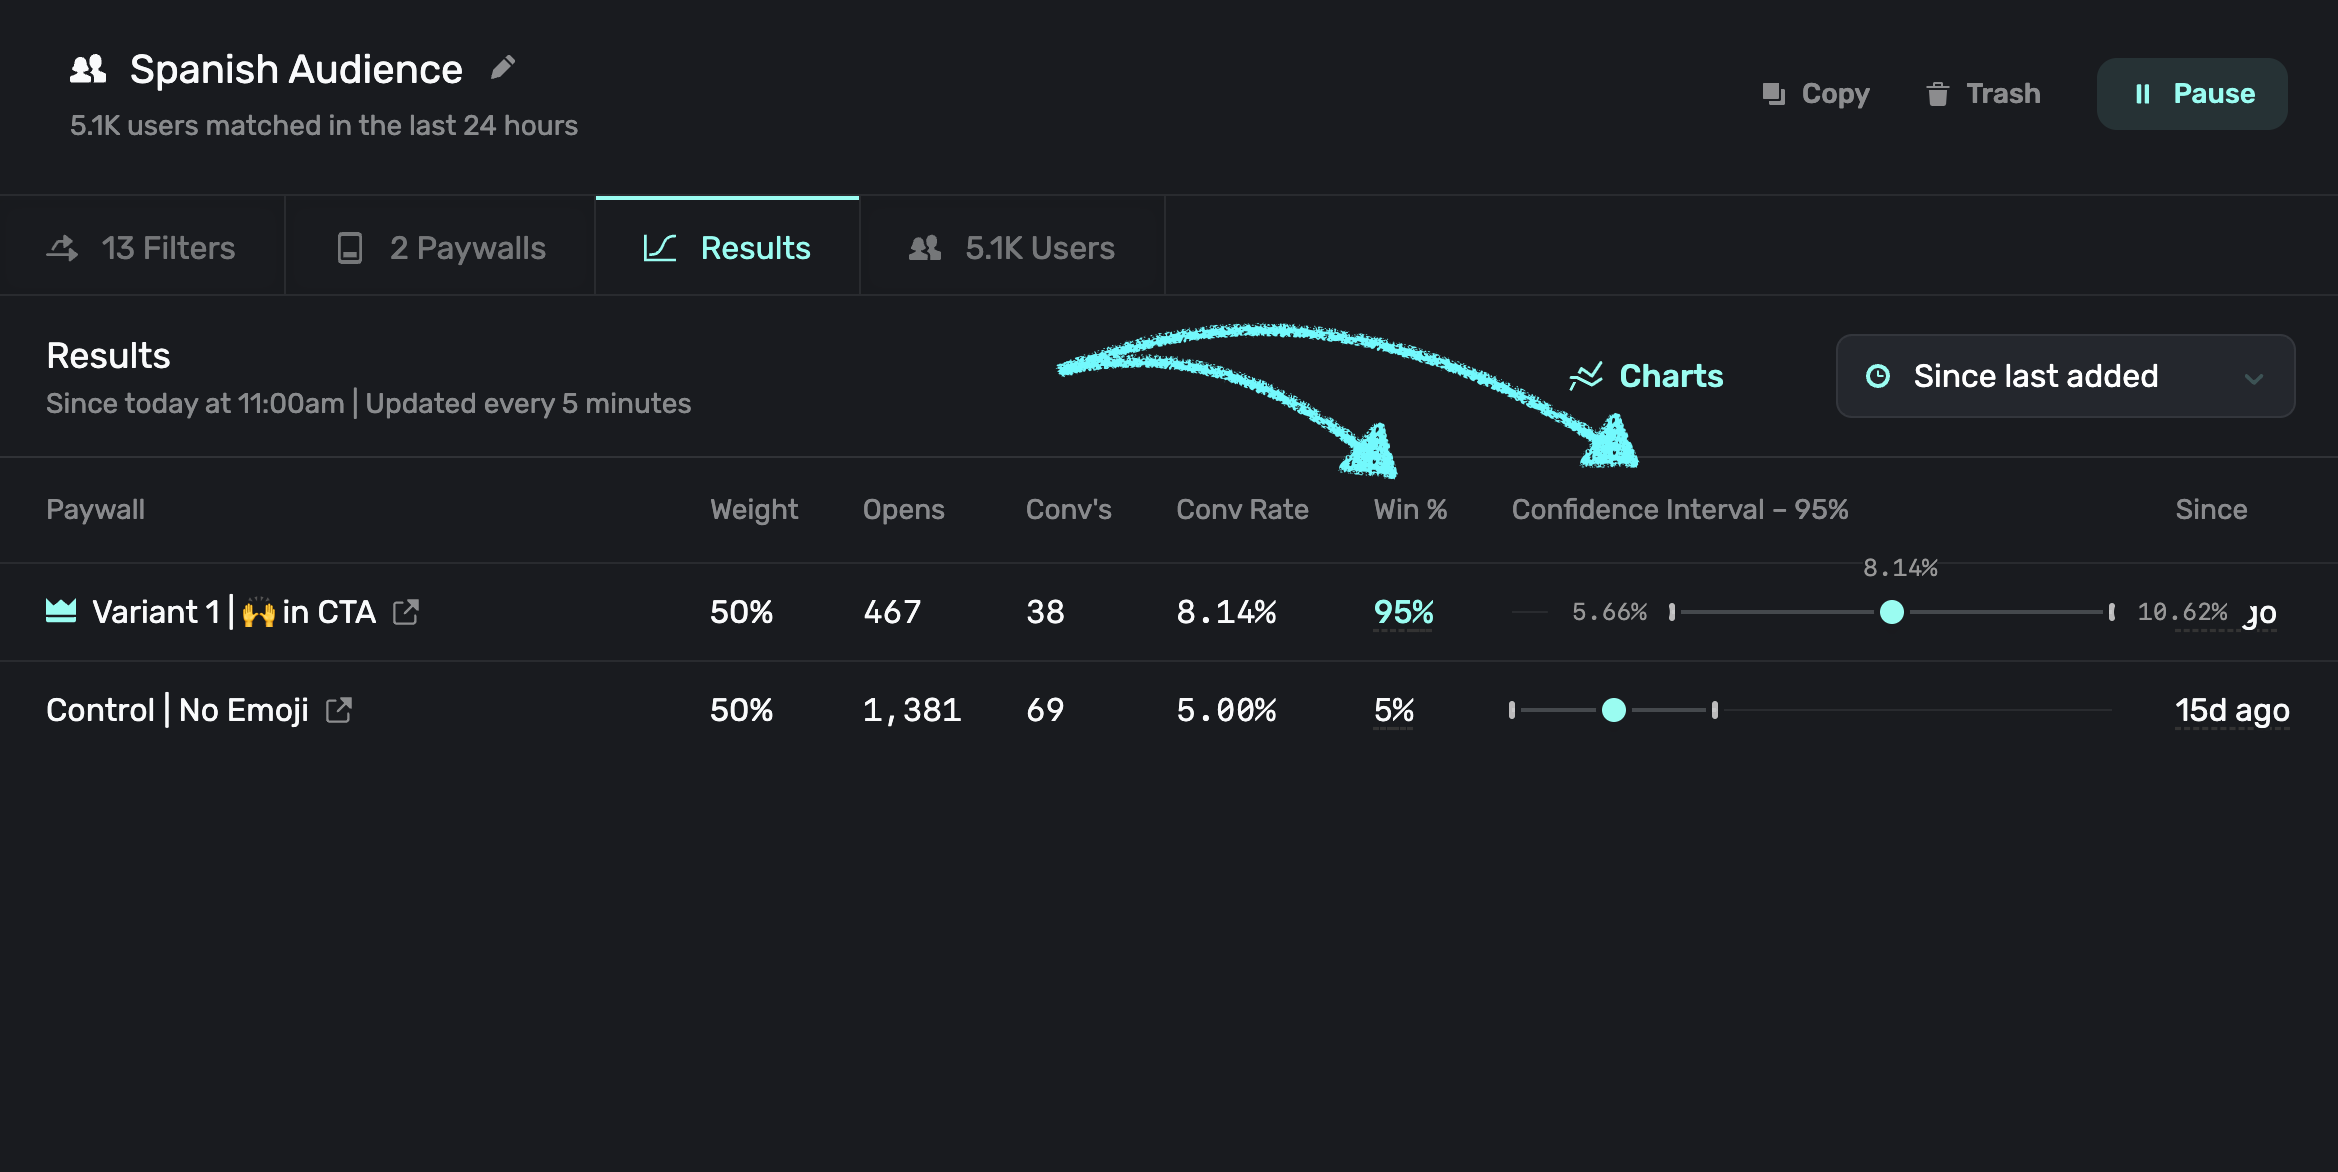
Here's what they tell you:
Win % — This new column uses Bayesian inference to determine a winner. Unlike traditional methods that just give you a snapshot, Bayesian inference continuously updates the winning probability as new data comes in. This means you get a dynamic view of which variant is leading, incorporating all the data collected up to the current moment. This approach is more intuitive and reflects real-time insights into your experiment's performance.
Confidence Intervals — On the other hand, the Confidence Interval column is grounded in the frequentist approach. It provides a range within which we are 95% confident the true conversion rate lies. This is crucial for understanding the reliability of your results. If the confidence intervals of two variants do not overlap, it's a strong indicator that you have a statistically significant difference. It's a more traditional approach but extremely powerful in determining the certainty of your results.
So how can we answer our first 2 questions?
When can I consider an experiment finished?
You know your experiment is complete when your Win % is greater than or equal to 95%. Superwall places a crown next to a variant when it gets there, but feel free to call it quits earlier if it makes good business sense. Remember – running more experiments should be your #1 priority.
How much did our conversion rate increase?
It's easy to forget how important this question is – especially when you are spending money on ads. Since a higher conversion rate changes the unit economics of your business, you need accurate data to scale ad-spend properly when a winner is declared. To be super conservative, consider your conversion rate might be at the lower bound of the 95% confidence interval. Ask yourself if you can stomach spend in this worst case scenario before scaling.
With these two powerful tools at your disposal, you'll have a clearer, more comprehensive understanding of your experiments. No more guesswork or external calculators; just solid, data-driven insights right at your fingertips.
Happy monetizing!